Profit with a single brick, When Optimization goes Wide
This project focuses on optimizing a trading strategy initially built in Pine Script. Manual backtests showed potential, but the vast parameter space—spanning multiple symbols, timeframes, and categorical variables—demanded a more systematic approach. Since standard backtesting tools were insufficient, we developed a custom Python framework capable of efficiently exploring this space and identifying robust, profitable configurations of the “single brick” strategy.
- Figure 0: Live Test on Demo from 2023-11-20 to 2025-09-18
Table of Contents
- Table of Contents
- 1. Abstract
- 2. Introduction
- 3. Methodology for Optimization
- 4. Implementation
- 5. Results and Analysis
- 6. Conclusion
- 7. License
1. Abstract
This report presents the methodology and results of a comprehensive optimization process for a trading strategy initially prototyped in Pine Script. Preliminary manual backtesting indicated promising performance across various financial symbols, which prompted a deeper, more systematic investigation.
The core challenge addressed by this project was the immense scale of the parameter space. The optimization needed to account for numerous variables, including a wide array of symbols, multiple timeframes, and a mix of numerical and categorical strategy parameters. Standard backtesting platforms, such as MetaTrader’s Strategy Tester, are typically designed for single-instrument, single-timeframe optimization and proved inadequate for this multi-dimensional problem.
To overcome this limitation, we developed a custom optimization framework in Python. This solution was engineered to systematically explore the wide parameter landscape, handle the complexities of categorical inputs, and identify robustly profitable configurations of the “single brick” strategy across the entire dataset.
2. Introduction
Project Goal
The primary objective was to construct a productive portfolio from a single trading strategy applied across a diverse set of financial symbols. This required creating and evaluating a vast number of virtual portfolios. Each portfolio consisted of the same core strategy but was applied to different symbols with varying parameters, including different volume management techniques. A key requirement was to backtest all parameter sets and optimize them using an efficient algorithm and relevant performance metrics to identify the most robust configurations.
The Challenge
The primary challenge was the sheer scale and complexity of the optimization space, which presented several specific difficulties:
- Exhaustive Backtesting Requirement: Every potential parameter combination within the optimization space had to be backtested to generate performance metrics for comparison, a computationally intensive task.
- Vast Parameter Space: The combination of numerical and categorical parameters created an exceptionally wide search space.
- Handling Categorical Parameters: Several key parameters, such as the choice of financial symbol, were categorical. Unlike numerical parameters, these cannot be optimized with many standard algorithms and must be evaluated in a product space (i.e., every combination must be tested).
- Portfolio Dependencies: The performance of individual strategies within a portfolio are interdependent. This meant that categorical parameters (like the set of symbols) could not be optimized in isolation. They had to be evaluated together with all numerical parameters, which multiplied the complexity and made the optimization space immense.
Standard backtesting platforms are not designed for such multi-dimensional problems, which necessitated the development of a custom solution.
3. Methodology for Optimization
Core Concept: “The Single Brick”
The “Single Brick” refers to the core trading strategy used as the fundamental building block for all portfolios in this project. It is a simple mean-reversion strategy. While the strategy itself is straightforward, the primary goal of this project was not to invent a novel trading algorithm, but rather to develop a robust framework for creating and optimizing portfolios built from this single, repeatable component.
Optimization Space
The optimization space was the Cartesian product of the core strategy’s parameters, the set of available symbols, and portfolio-level constraint parameters. The inclusion of the symbol set introduced a significant categorical parameter challenge. Furthermore, the portfolio-level parameters (such as maximum concurrent trades) created dependencies between the individual strategies. This meant the categorical parameters could not be optimized independently, forcing a much larger, combined search space to be evaluated.
Handling Categorical Parameters
To manage the complexity introduced by categorical parameters (the symbols) and their inter-dependencies within a portfolio, we adopted a simplified, pragmatic approach. Instead of optimizing the entire portfolio space at once, we optimized the strategy’s numerical parameters for each symbol individually.
This method effectively sidestepped the core challenges by breaking the problem down. However, this simplification came with a significant trade-off: we lost the ability to optimize for portfolio-level effects where the performance of one strategy is dependent on others. While this approach was far more straightforward to implement, it meant that the true, globally optimal portfolio configuration might not be found. The challenge of holistic portfolio optimization remains an area for future investigation.
Choice of Optimization Algorithm
A natural starting point for many optimization problems, particularly in machine learning, is a gradient-based method like gradient descent. However, these algorithms are mathematically defined for continuous and differentiable objective functions (hyper-surfaces). Our optimization landscape does not meet these criteria; the objective function is a “black-box” evaluation of a backtest, resulting in a response surface that is non-linear, discontinuous, and for which no gradient can be calculated.
This class of problem requires a derivative-free or “black-box” optimization algorithm. While options like genetic algorithms exist, we selected Particle Swarm Optimization (PSO) for this project.
PSO is a powerful metaheuristic inspired by the social behavior of bird flocking or fish schooling. The core idea is that each potential solution, or “particle,” moves through the multi-dimensional parameter space. Its movement is influenced by its own best-known position and the best-known positions of other particles in the swarm.
This approach is exceptionally well-suited for our needs because it is designed for problems where:
- The search space is large and high-dimensional.
- The objective function is non-linear, discontinuous, or computationally expensive to evaluate.
Performance Metrics
To guide the optimization process, it is essential to define a clear objective function—a single metric that quantifies the “goodness” of a strategy configuration. This metric allows the optimizer to compare different parameter sets and systematically navigate toward a better solution.
A trading strategy’s performance can be assessed from many perspectives, including total return, risk-adjusted return (e.g., Sharpe Ratio), win rate, and consistency. For this project, we aimed to find a balance between profitability and risk. Consequently, we chose two primary factors:
- Total Profit: The absolute financial gain generated by the strategy.
- Maximum Drawdown: The largest peak-to-trough decline in portfolio value, representing the maximum unrealized loss.
To combine these into a single objective function for the PSO algorithm, we used the Ratio of Total Profit to Maximum Drawdown. This metric rewards strategies that generate high profits while penalizing those that incur significant capital risk, effectively steering the optimization toward more robust and stable outcomes.
4. Implementation
Strategy Backtesting Engine
To evaluate each candidate solution (a specific set of parameters) generated by the optimizer, we must perform a historical backtest. This process simulates the strategy’s performance on past data to calculate its objective function value. Therefore, a robust and flexible backtesting engine is a critical component of our optimization framework.
The engine needed to be highly extensible to meet several key requirements:
- Custom Metrics: The ability to define and calculate our specific objective function (Profit/Drawdown).
- Detailed Analytics: The capacity to extract a wide range of performance factors beyond the primary metric for deeper analysis.
- Portfolio-Level Testing: The capability to run backtests on selected portfolios with their final optimized parameters.
For these reasons, we selected Backtrader (https://www.backtrader.com), a popular open-source backtesting framework for Python. Backtrader was an ideal choice due to its:
- Extensibility: It is designed to be easily extended through class inheritance, allowing us to integrate our custom strategies, analyzers, and metrics seamlessly.
- Performance: It is known for its efficient operations, which are crucial when running the thousands of backtests required by the optimization loop.
- Accessibility: It provides deep access to internal variables and the state of the backtest at every step, which is essential for detailed analysis and debugging.
The Optimization Loop
The optimization process connects the PSO algorithm with the backtesting engine in a structured loop. Given our decision to optimize each symbol individually, the high-level plan was as follows:
-
Iterate Over Symbols: The process begins with a loop that iterates through each financial symbol targeted for optimization.
-
Instantiate Optimizer: For each symbol, a PSO solver is initialized. We chose the
Optunitylibrary for this purpose, as it provides a straightforward and powerful implementation of PSO and other solvers. -
Generate and Evaluate: The
Optunitysolver suggests a set of numerical parameters for the strategy. These parameters are passed to ourBacktraderengine, which runs a complete backtest and calculates the objective function (Profit/Drawdown ratio). -
Feedback and Iteration: The value of the objective function is returned to the
Optunitysolver. The solver uses this result to update the particle swarm, guiding the search toward more promising regions of the parameter space. This cycle repeats for a predefined number of iterations or until convergence criteria are met.
To significantly speed up this computationally intensive process, the outer loop over the symbols was parallelized using the Joblib library. This allowed us to run optimizations for multiple symbols concurrently across different CPU cores, drastically reducing the total time required to find the optimal parameters for the entire symbol universe.
5. Results and Analysis
Optimization Process Analysis
The optimization process operates primarily on numeric parameters, taking into account their dependencies. Conceptually, this creates a high-dimensional search space, where the optimizer seeks to locate the minimum (or optimum) of a complex hypersurface.
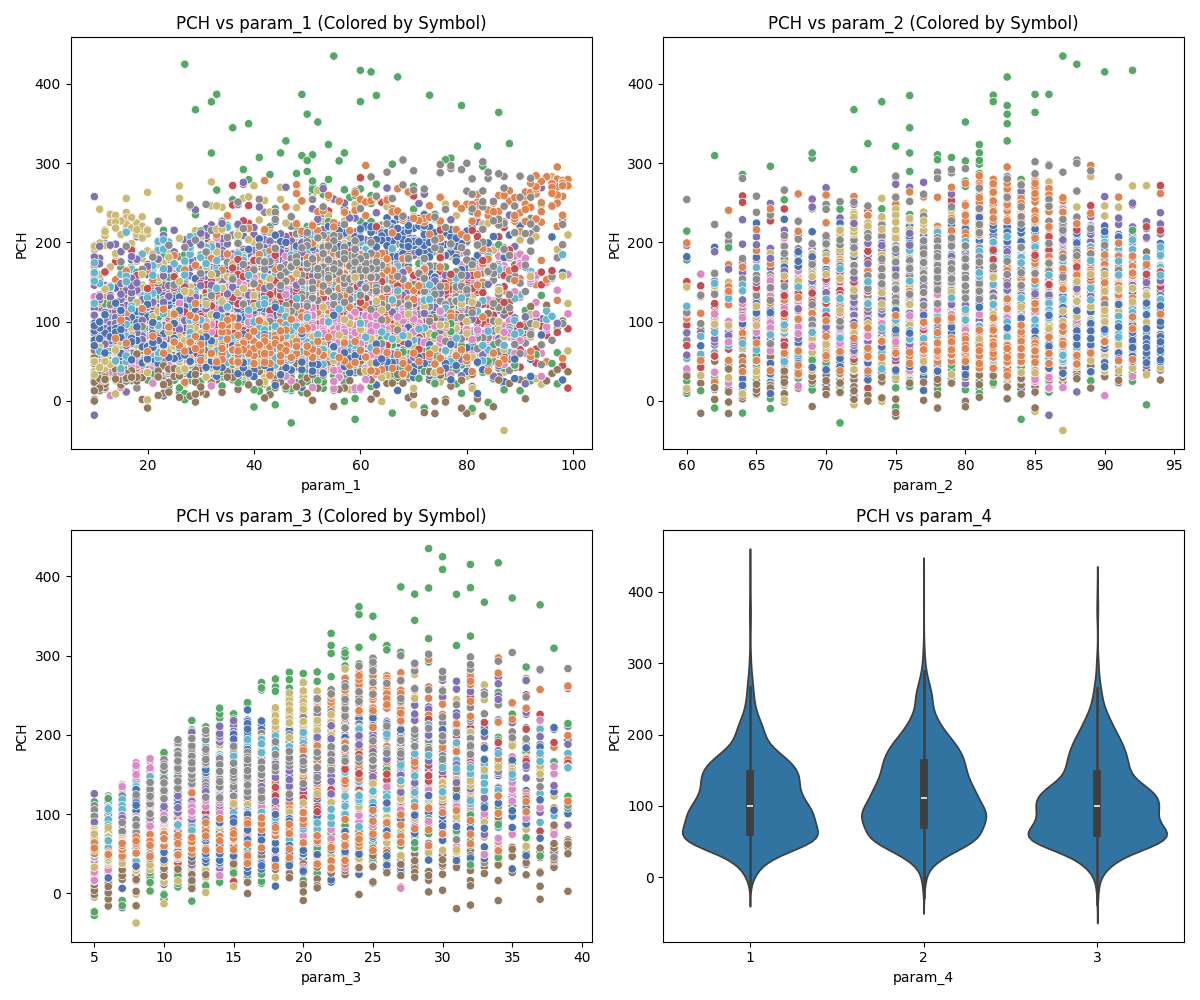
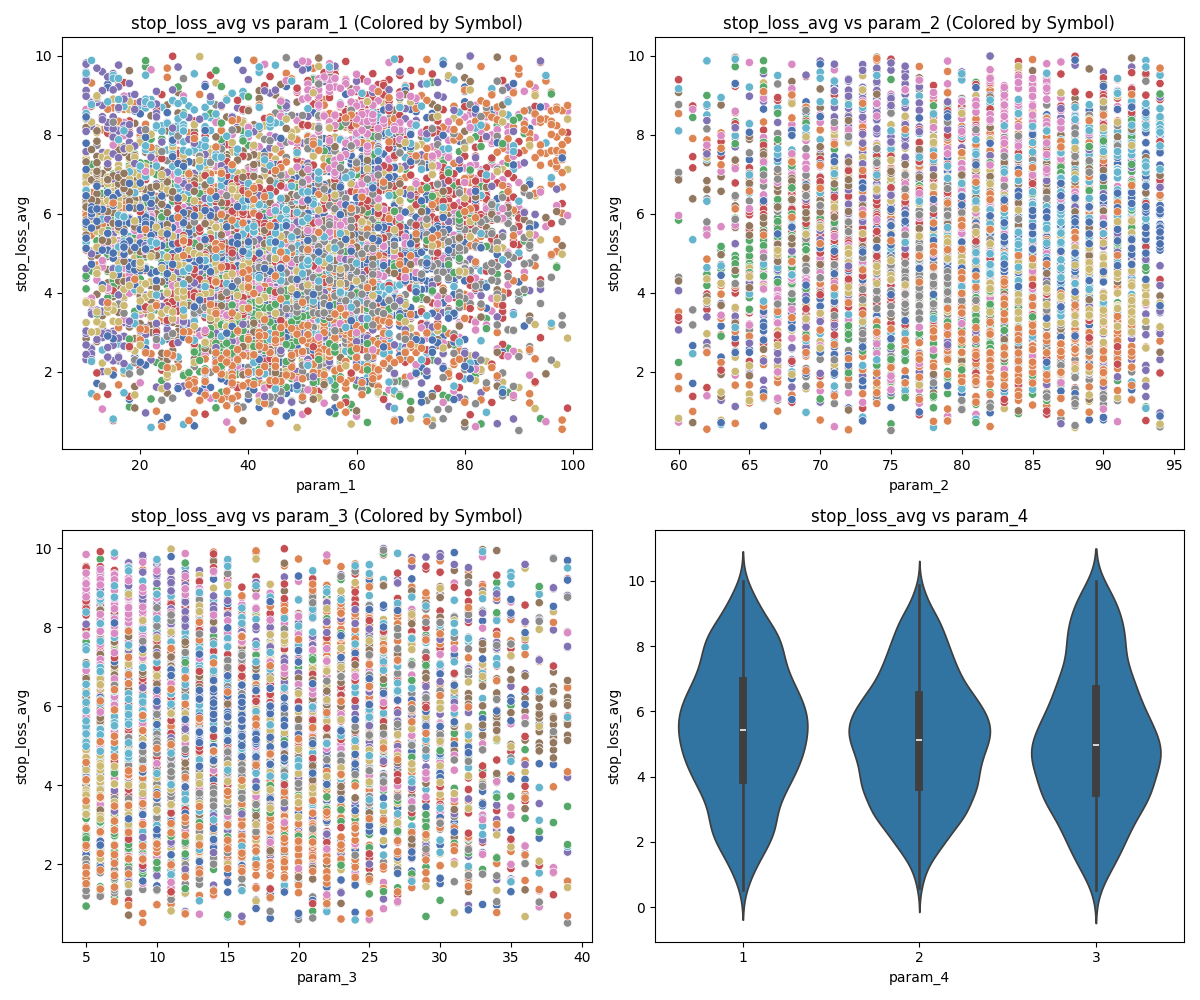
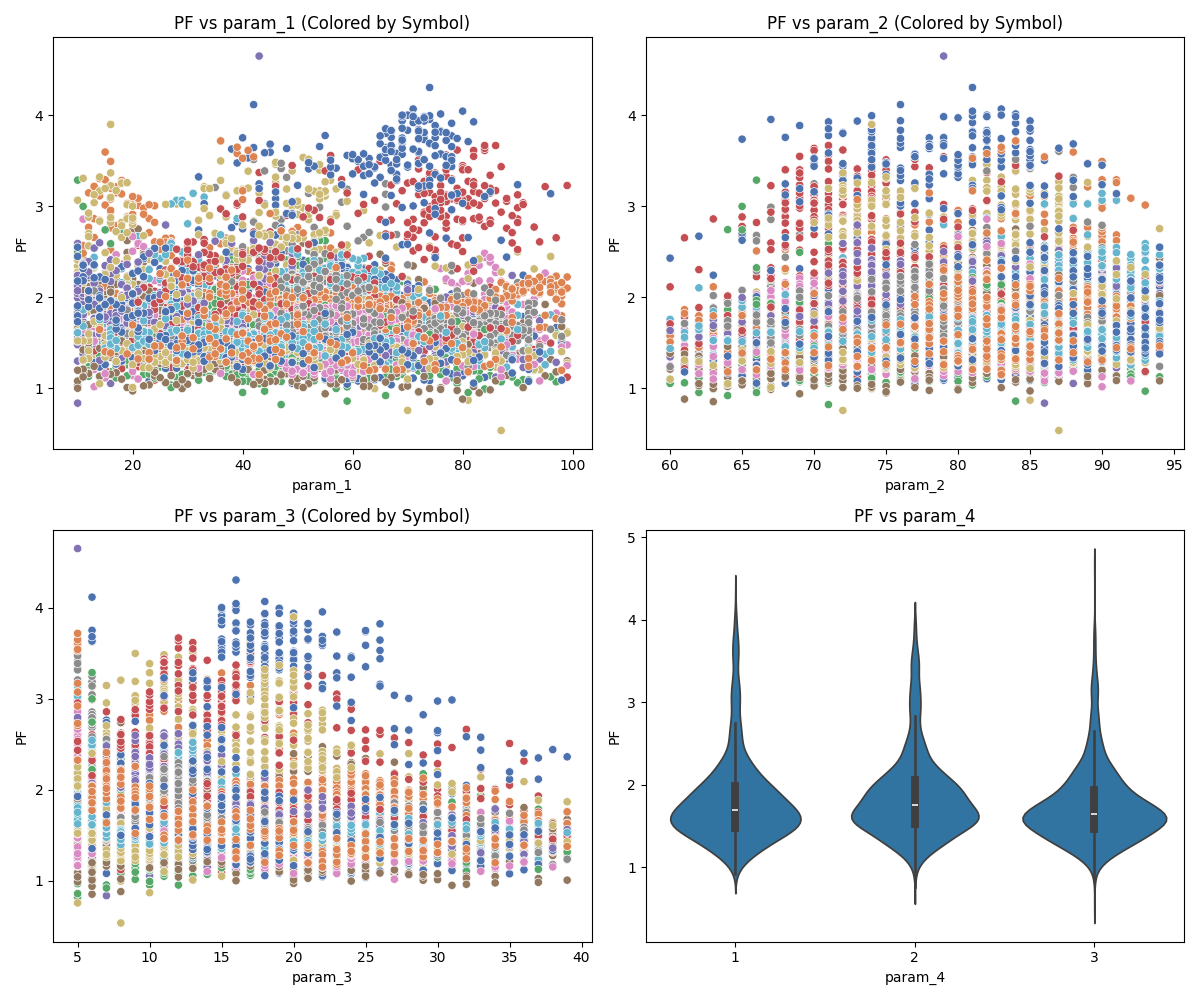
For clearer presentation, we analyzed the effect of each parameter on selected strategy metrics during the optimization process. The following figures illustrate which parameters significantly influence strategy performance and in what manner.
Key Points from Parameter Analysis
- Parameter 1 – Generally not an effective feature, except for isolated cases in specific symbols.
- Parameter 2 – Shows a consistent increase in profit without materially altering risk.
- Parameter 3 – Appears to be a strongly effective parameter, influencing both reward and risk dimensions.
-
Parameter 4 – Does not change mean values directly, but increases variance in maximum drawdown, which is highly relevant for risk management.
-
Figure 1: Parameter 1 impact on metrics
-
Figure 2: Parameter 2 impact on metrics
-
Figure 3: Parameter 3 impact on metrics
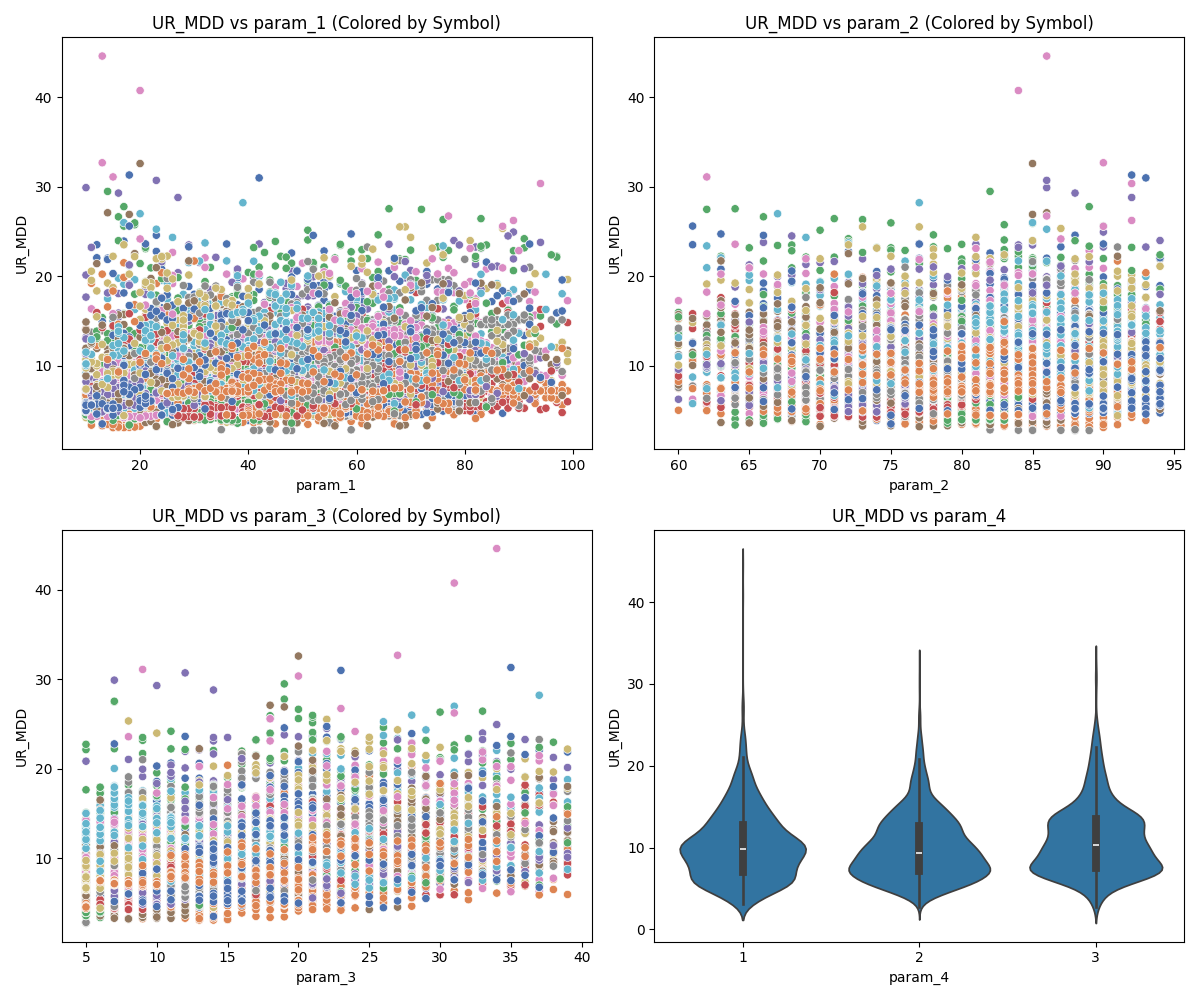
- Figure 4: Parameter 4 impact on metrics
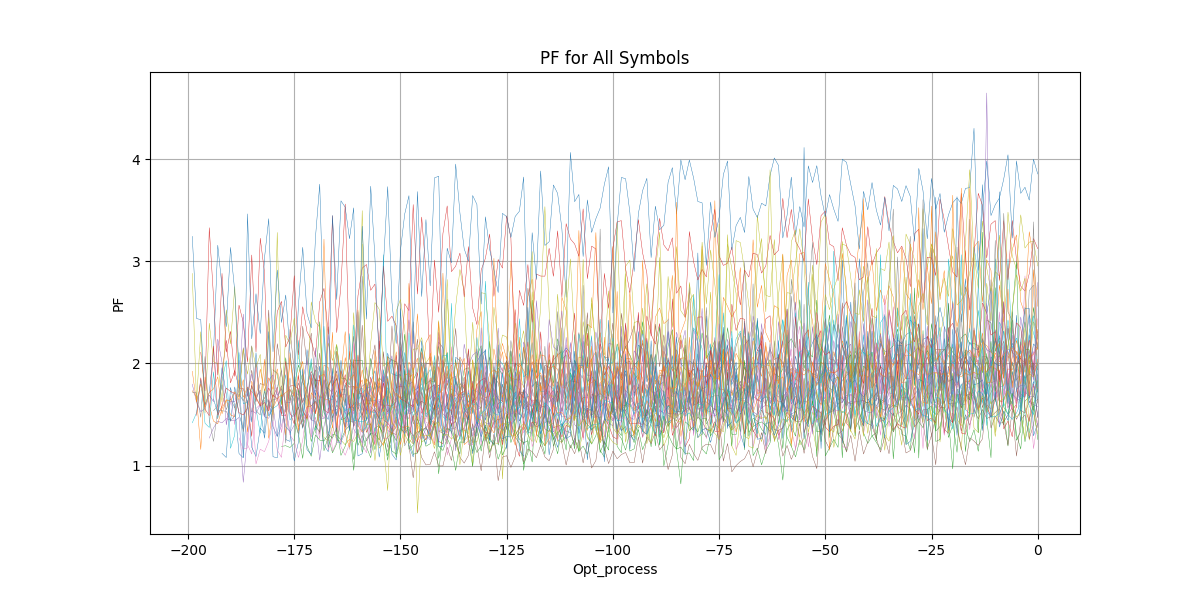
During the optimization process, performance metrics evolve over iterations. Ideally, optimization should improve them according to their natural definitions, but in practice, the results reveal nuanced behavior:
- Profit Factor (PF) – Increases steadily as expected.
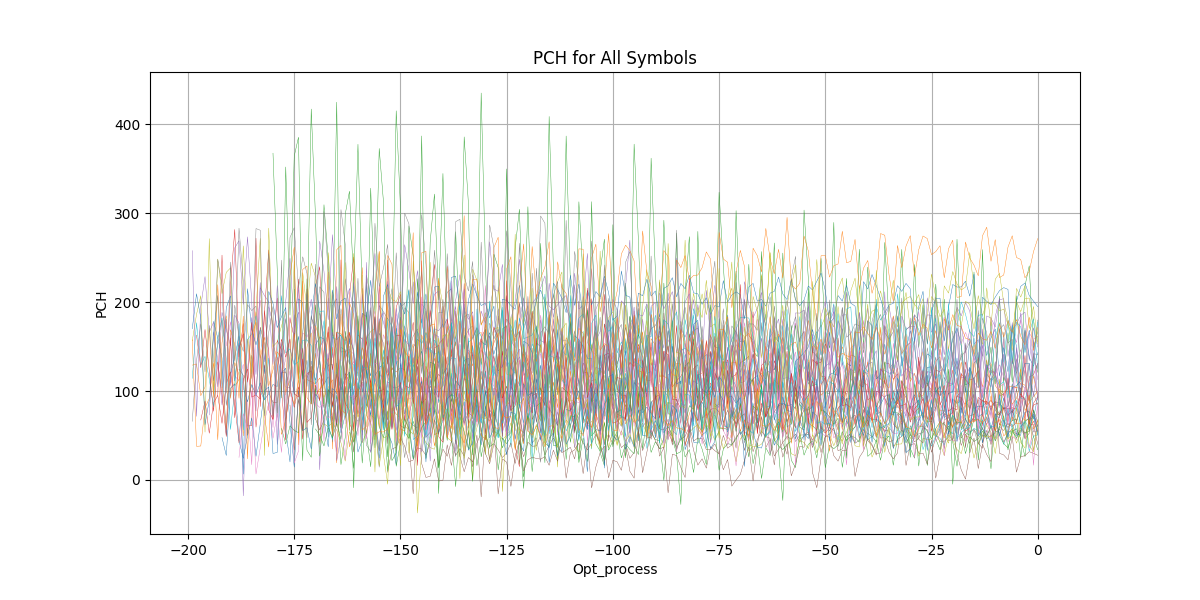
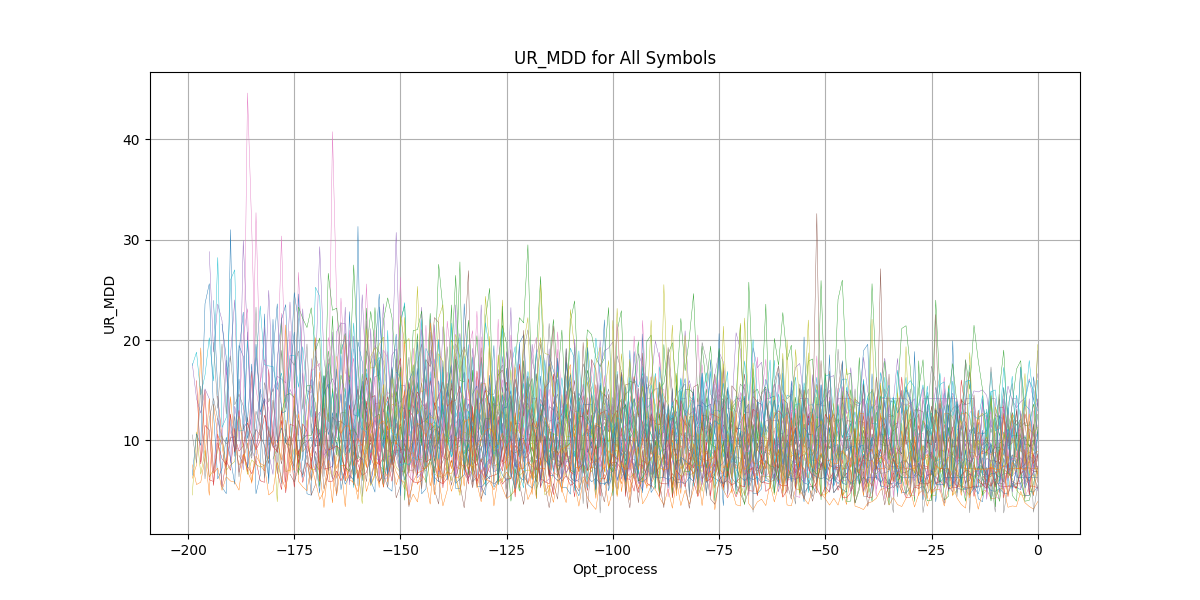
- Percent of Change (PCH) – Surprisingly does not increase; in fact, it falls slightly. This indicates that PF improvements came primarily from lowering drawdown (UR_MDD), as illustrated in the charts.
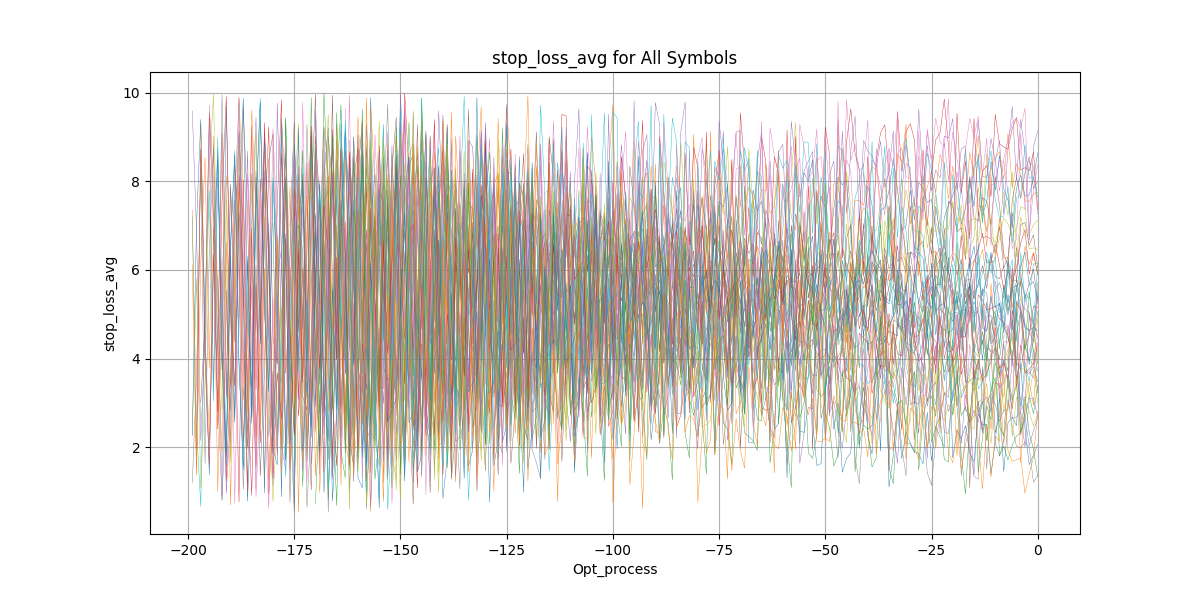
- Stop Loss Dynamics – The average stop loss analysis suggests differing symbol behaviors:
- For some symbols, lowering risk (tighter stop losses) proves more effective.
- For others, higher risk tolerance correlates with greater profitability.
-
Figure 5: Profit Factor During Process
-
Figure 6: Percent of Change During Process
-
Figure 7: Unrealized Drawdown During Process
-
Figure 8: Averege of Stoploss During Process
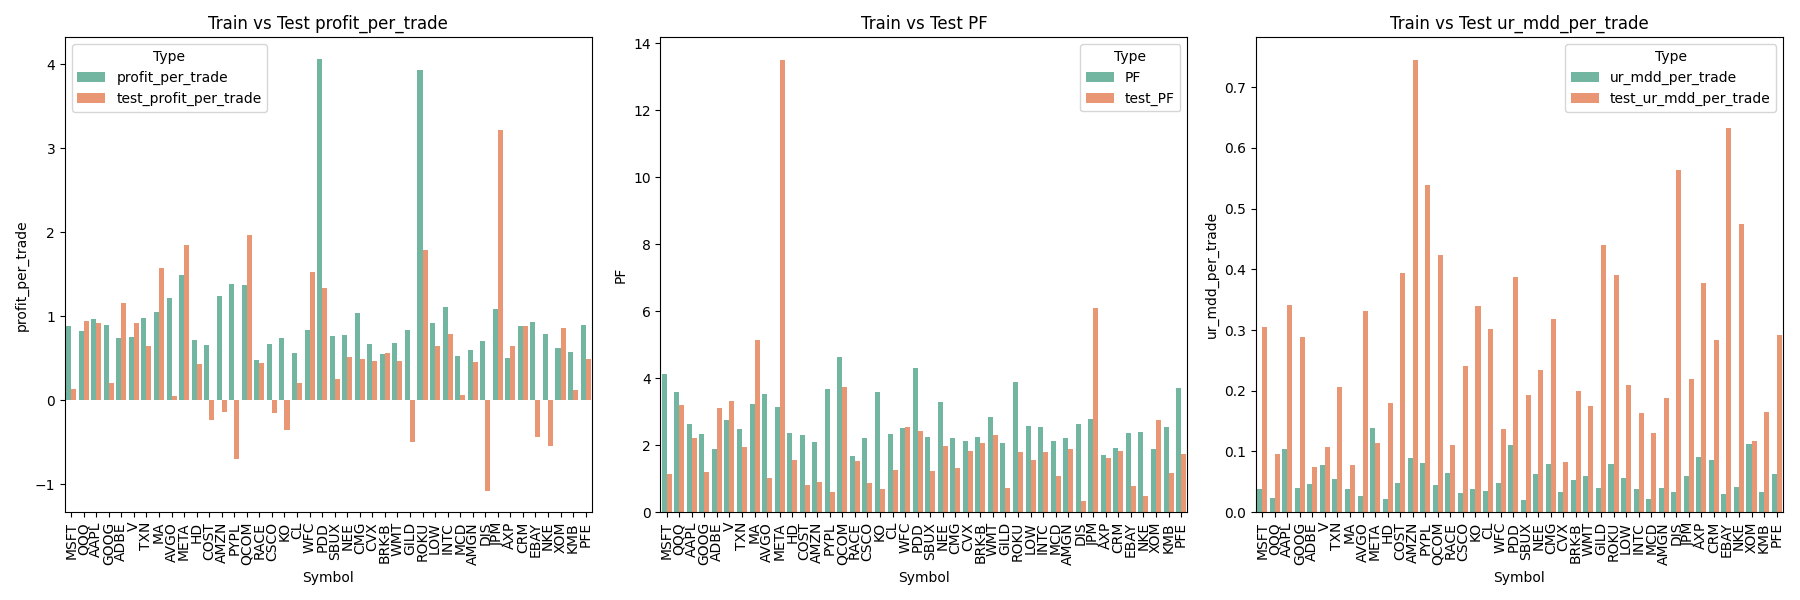
Optimized Results Analysis
Now this is the final selected portfolio, backtested across both train and test sets.
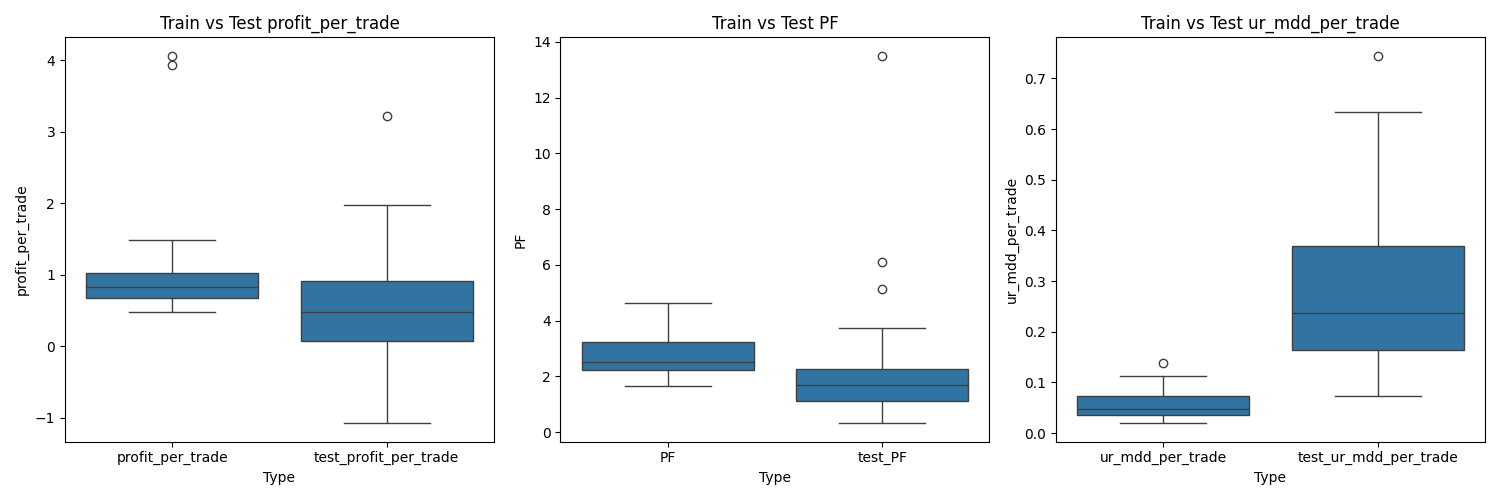
The analysis shows that the Profit Factor (PF) remains consistent between train and test, which validates our work to some degree.
Similarly, Profit per Trade is stable across both sets, but its deviation differs noticeably, indicating variability in trade-level outcomes.
The Maximum Drawdown per Trade is deeper in the test set compared to the train set. This suggests that the drawdown is not a recurring or systematic issue but rather occurred once or twice during the backtest period.
Overall, this implies the strategy requires a longer time horizon to confidently prove profitability and to absorb and recover from its inherent risks.
-
Figure 9: Barchart to Compare Train and Test Values
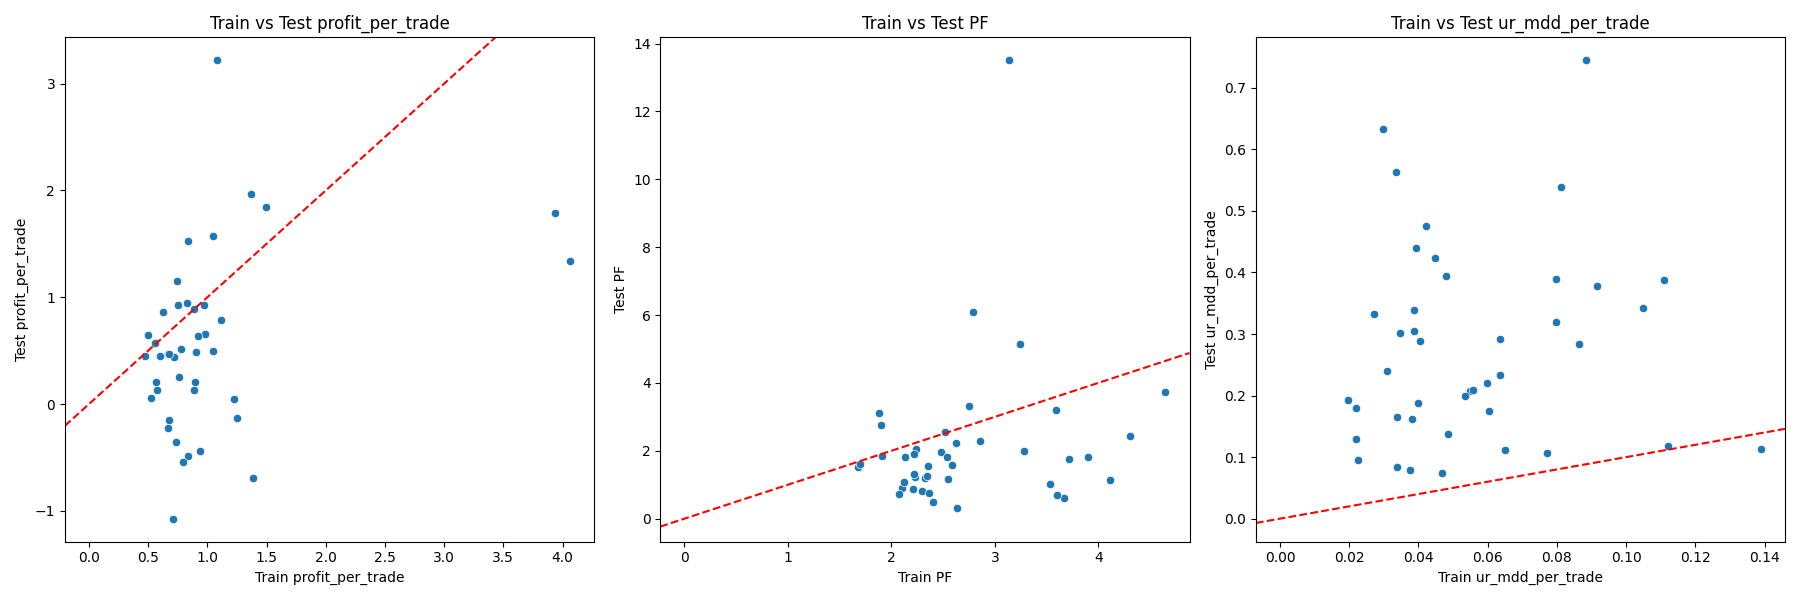
-
Figure 10: Scatter Plot to Compare Train and Test Values
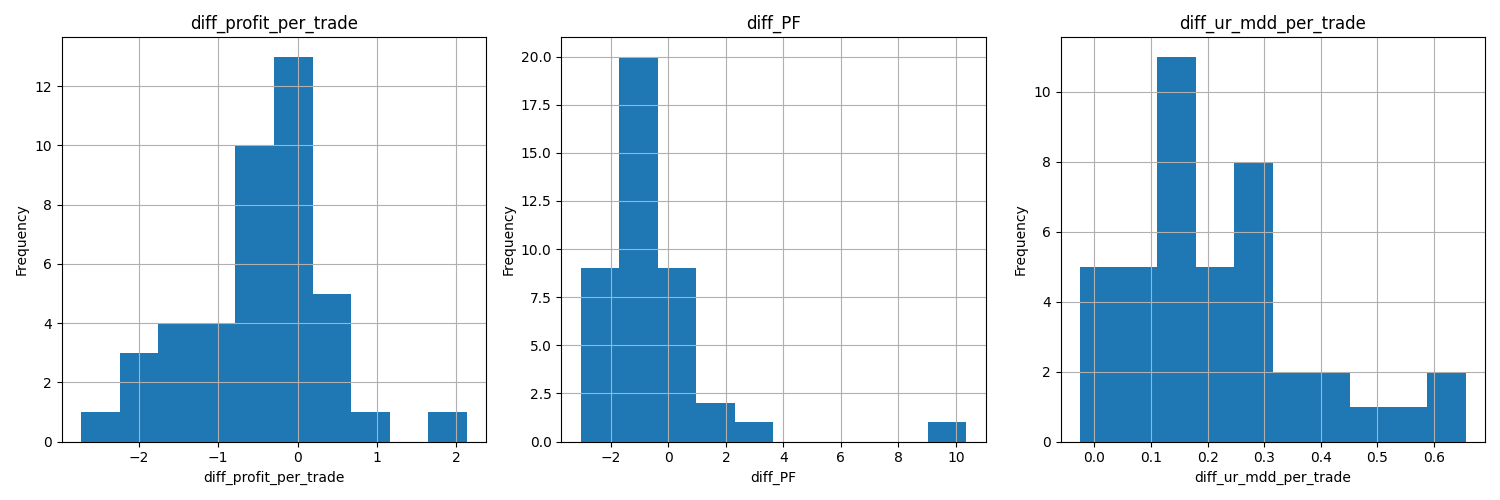
-
Figure 11: Histogram of Train and Test Differences
-
Figure 12: Boxplot to Compare Train and Test Data Deviation
Final Strategy Outcome
We obtained the results and implemented them as an MQL4 Expert Advisor on the Windsor broker platform. The system was launched on 2023-11-20 and is still running. The performance results up to 2025-09-18 are presented below.
The strategy has demonstrated consistent profitability while maintaining minimal risk. However, it is important to note that consistent performance does not imply perfection, and further monitoring and optimization may still be necessary.
- Figure 13: Live Test on Demo from 2023-11-20 to 2025-09-18
Discussion of Findings
Except for the results shown, we identified a significant issue with this strategy. This problem has motivated further work on developing and testing various strategies. Specifically, the main limitation of this strategy is that it does not guarantee protection during a market crash. The portfolio can be exposed to sudden and substantial drawdowns, which may lead to considerable losses.
Addressing this issue is critical. Potential solutions could include implementing dynamic risk management, incorporating hedging techniques, or diversifying across multiple strategies and instruments to reduce vulnerability to extreme market events.
6. Conclusion
We observed that every trading strategy has its own inherent weaknesses. While this may be a common lesson often mentioned, truly understanding and internalizing it requires careful analysis and experience. The key takeaway is that no single strategy can be relied upon to perform optimally in all market conditions.
The most effective approach is to implement hedging strategies that complement each other, covering one another’s weaknesses. In this context, portfolio management becomes more than just maintaining a basket of strategies; it evolves into the systematic orchestration of trading algorithms that interact and balance risk, ensuring more robust performance across different market scenarios.
This insight emphasizes the importance of designing portfolios that are adaptive, resilient, and strategically diversified, rather than relying on individual strategies to perform perfectly.
7. License
This project is licensed under the TradeYaar License - see the LICENSE file for details.